 This article (based on a paper presented at Methods IX, University of Wales,Bangor, July 30, 1996) is available in a collection of papers from thatconference entitled Issues and Methods in Dialectology editedby Alan Thomas and available from the Departmentof Linguistics, Universityof Wales, Bangor, who have given their kind permission for it to be reproduced here. The text and the maps within it are copyrighted.
The Perception of "Standard" as the Speech Varietyof a Specific Region:
Computer-Produced Composite Maps of Perceptual DialectRegions
Daniel Long
Tokyo Metropolitan University
dlong@tmu.ac.jp
1. Introduction
In Japan, as in many other nations, the official characterization ofthe standard language variety contends that it is not the language varietyof any one specific region of the country (Shibatani 1990: 185-187). Whilethis very diplomatic conceptualization of the standard does serve a purpose,in reality, many (though by no means all) Japanese speakers consider itcommon sense that hyôjungo (standard Japanese) is a languagevariety spoken in and around Tokyo. In this paper, I employ a "PerceptualDialectology" methodology, inspired by the work of Dennis Preston (1988)in the United States, in an attempt to shed some light on the geographicalperceptions Japanese speakers have of the standard variety of their language.I propose some methodological innovations, namely techniques for the mappingof means and standardized values, the utilization of "proportion tests"(Davis 1990) to determine statistical significances between two maps, andthe mapping of these significance test results themselves.
2. Speech Variety Labels
In a series of surveys conducted in eight regions of Japan, I collectedhand-drawn maps from 756 informants native to their respective regions.I converted the geographical boundaries of the 5517 hand-drawn perceptualspeech variety regions into numerical data using a digitizer, and usedprivately-developed software to produce numerous "composite" perceptualdialect maps. (For a detailed outline of this methodology, see Long 1990aor Long forthcoming b.)
Here I will examine the types of language variety labels which the informantsapplied to the speech regions they drew, but first I should clarify thatthere were two situations in which informants' responses were regardedas unusable and not included in the data. One was cases in which informantswrote a speech variety label on the map but did not draw boundaries todefine the region of its usage. The other was the opposite case in whichinformants drew the boundaries for a region but did not label it. Onlyterms which clearly referred to language were regarded as speech varietylabels. Thus, an area labeled "Hiroshima-ben" 'Hiroshima dialect'was included in the data, but one simply labeled "Hiroshima" was ignored.
There were a total of 257 different speech variety labels used. Thesemay be divided into two main types: locative labels which employa word indicative of a place, and non-locative labels which do not.Locative labels consist of two parts, a locative descriptor plusa variety descriptor. Both Japanese and English have a large arrayof variety descriptors. Informants in Preston's (1989:44) study of perceptualdialects of the United States gave the following variety descriptors (shownwith frequency of occurrence): accent (45), English (25), drawl (14), speech(5), twang (3), jargon (2), style (1), lingo (1), dialect (1), slangs (sic,1), and talk (1).
In this study, the most common variety descriptor was ben 'dialect',used 4855 times and accounting for 88% of the total labels. Interestingly,the term hôgen 'dialect', preferred by linguists, accountedfor only 4.1% (228 occurrences) of the total. The other descriptors (withtheir frequencies) were as follows: go 'language' (378 occurrences;6.9%), kotoba 'talk' (43 occurrences; 0.8%), namari 'accent'(9 occurrences; 0.2%), guchi 'language' (Okinawan term, 2 occurrences),kei '-related' (1 occurrence), gengo 'language' (1 occurrence).1With locative descriptors, as well, we can identify certain subtypes, namelyspecific locatives which refer to a specific place, such as "Tokyo-ben",and generic locatives which refer to a general type of place, suchas "shima-kotoba" 'island talk'.
3. Is "Standard" a Language Variety with a Region?
First, let us examine how many of our informants gave "standard Japanese"as the variety spoken in a specific region.2In the survey, we did not ask informants to identify, for example, thearea where they thought people used "standard Japanese" or "Kyoto Dialect",etc. Rather we asked them to "draw lines to designate areas where the speechdiffered".3Thus, both the question of how many speech regions Japan can be dividedinto, and of what those speech divisions are was left to the discretionof the informant. The smallest number of perceptual dialect regions drawnby an informant was 2, and the greatest number drawn by a single informantwas 23. The mean number of regions drawn by one informant was 7.3.
In light of this, we will begin our discussion of the perceptional regionsfor "standard Japanese" with an examination of how many informants labeledareas as standard on their maps. 281 informants, roughly one-third of thetotal, drew "standard Japanese" as a region on their maps, but as we seein table 1, there were great differences among the percentages for eachinformant region.
Table 1 Frequency of Speech Varieties by Informant Region
| Regions | Tokyo | Nagoya | Gifu | Kanazawa | Osaka | Hiroshima | Fukuoka | Kagoshima | total |
| Informants | 75 | 118 | 28 | 46 | 244 | 34 | 86 | 125 | 756 |
| "standard" n | 26 | 27 | 15 | 25 | 72 | 13 | 30 | 73 | 281 |
| "standard" % | 34.7 | 22.9 | 53.6 | 54.3 | 29.5 | 38.2 | 34.9 | 58.4 | 40.7 |
| "standard" stnd. | 45.0 | 35.3 | 60.5 | 61.0 | 40.4 | 47.9 | 45.1 | 64.4 |
| "Kantô-ben" n | 22 | 11 | 5 | 6 | 127 | 6 | 10 | 12 | 199 |
| "Kantô-ben" % | 29.3 | 9.3 | 17.9 | 13.0 | 52.0 | 17.6 | 11.6 | 9.6 | 20.0 |
| "Kantô-ben" stnd | 56.8 | 42.0 | 48.4 | 44.7 | 73.6 | 48.1 | 43.7 | 42.2 |
Based on the antagonistic attitude among many Osaka speakers towards Tokyocited in past language attitudes studies (Long 1990b), we might have expectedthe Osaka informants to show more reluctance than others about acknowledgingthe existence of a "standard", but at first glance this does not appearto have occurred. But let us look at the standardized scores in table 1for the speech varieties "standard" and "Kantô-ben". Thesenumbers provide a hint as to why the percentage of informants listing "standard"on their maps is no lower in Osaka than in other regions. Although a typicalone-third of the people from Osaka have conceded that "standard" is a speechvariety with a geographical region, we find that they, more than any otherinformant group, tend to recognize the existence of "Kantô-ben"'Kantô dialect' as a speech variety. With a standardized score exceeding69.6, we see that this difference is statistically significant. Furthermore,although there appears to be no great difference between Osaka and theother groups regarding the frequency of "standard", there are, as we shallsee later, major differences in the geographical areas regarded as such.These results do indeed tell us something about the dialect perceptions(and attitudes) of the Osaka informants. The fact that they view the speechof the Kantô region as a dialect, rather than the standard, to asignificantly higher degree is evidence of their reluctance to concedeto a Tokyo-based standard. In other words, compared to informants of otherregions (even the regions of Western Japan in our study, which are generallyless fond of Tokyo speech than are the regions of Eastern Japan), Osakainformants think of the speech of the Tokyo area not as "standard" butas the dialect they call "Kantô-ben".
4. Percentage Map
In our study, we obtained data from informant groups native to eightdifferent regions of Japan, and as we saw above, between 23 and 58% ofthe informants chose to indicate "standard" as a geographically-definedlanguage variety in their answers. Due to space restrictions, we cannotexamine all of the "standard" maps here, but we will look at the maps drawnby the Nagoya and the Osaka informants, in an effort to find both the commonand unique aspects of the response patterns of the two groups.
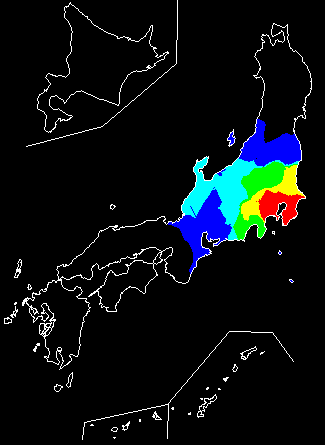
First, look at the map of standard-speaking areas compiled from theresponses of the Nagoya informants (figure 1, which has the locations mentionedin this paper labeled for reference). The strongest tendency we find hereis to indicate a core area centered around Tokyo and radiating outwardfrom there. A look at the Osaka informants' results in figure 2 shows usthat this is a shared tendency. In fact, this tendency is seen in the mapsof all eight informant groups. Something else which strikes us about figure1 is the way in which the home region of the Nagoya informants is not includedwithin the standard area. It would appear, in fact, that the home regionhas been carefully excluded, since Nagoya itself is included only at thelowest level (1-19%), while it is almost surrounded by areas of the 20-39percentage range.
Figure 1, Nagoya informants "standard" (percentages)
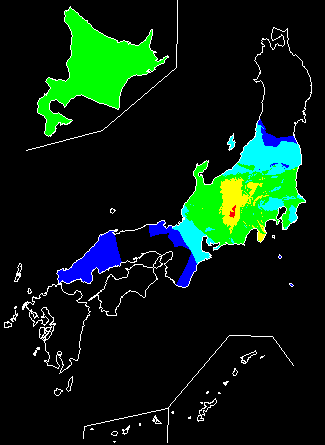
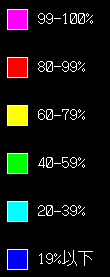 Incontrast, figure 2 shows us that the level of Osaka people who perceivethe Nagoya region as being standard-speaking is in the 20-39% range, andthus exceeds the level indicated by the Nagoya informants themselves. Withthe Osaka informants, in addition to the fair number who perceive "standard"areas to the east of them, there is even a small number who perceive standard-speakingareas west of themselves in the Hiroshima area. Here too, however, we findthat none of the Osaka informants identify the home region as "standard",and thus we may see this as another example of the "home region exclusion"tendency.
Figure 2, Osaka informants "standard" (percentages)
This tendency to exclude the home region from the standard-speakingarea also turned up in the maps of several other informant groups,4and to this extent we can view this phenomenon as a common characteristicamong many of the maps. While the phenomenon itself can be seen as a singletendency, it naturally produces a degree of variation into the data, however,since the area which comprises the home region varies from one informantgroup to the next. We shall discuss these differences between the informantsgroups' maps later in the paper.
Additionally, in figure 2 we see a strong perception of the northernmostisland of Hokkaidô (seen as an inset in the top left of the maps)as an area of standard usage. Although this tendency does not show up inthe Nagoya map, it did appear in six of the eight informant groups. Evenso, the perception of Hokkaidô as "standard" was strongest in theOsaka map with scores in the 20-39% range, while the other informant regionswere in the 1-19 percent range.5
On comparison of the two maps, we see that the Tokyo-centered core areais weaker in the Osaka informants' map than it is for the Nagoyans (and,incidentally, for the other six groups whose maps are not included in thispaper as well). This weakened core is, as a mater of fact, directly relatedto the strength of the Hokkaidô results here. Whereas the informantsin Nagoya (and the other six survey locations) all basically agreed that"standard" was centered in the Tokyo area, the votes for the Osaka informantswere split. While some informants drew lines to indicate that "standard"was used in both Hokkaidô and Tokyo, many others indicated strictlythe Hokkaidô area, excluding Tokyo altogether. This disagreementwithin the Osaka informant group resulted in a "standard" with not a singlecore area, but one split into two parts, neither of which obtained theextremely high percentages seen in the other maps.
Reviewing the results above, we can identify three clear tendenciesfor the perceptual region of "standard", outlined as follows: (1) a Tokyocore (a tendency, seen in the maps of all eight regions, to indicate acore area centered around Tokyo and radiating outward from there); (2)a Hokkaidô supplement (a less common tendency to include the northernisland of Hokkaidô); (3) home region exclusion (a tendency to avoidthe inclusion of the home region within the "standard" area).
Examining these maps visually, our natural inclination is to look fordissimilarities in them. Such dissimilarities give us insight into howpeople's perceptions of standard Japanese differ from one region to another.Visual comparisons of the two maps are, however, impressionistic and thuslacking in accuracy. The fact that the percentage values in the maps havebeen grouped into five levels further reduces the accuracy of our visualperceptions. For this reason, I searched for a method to determine thoseareas whose levels of perception differed at a statistically significantlevel. I will describe this procedure next.
5. Significance Test Results
One method for determining the unique characteristics of two informantgroups is to compare their results using what is commonly referred to asthe "proportion" test. The proportion test is used when the original datais in the form of a "yes/no" type question and the two values being comparedare percentages. Let us take a moment here to understand just what valuesare being used in the calculations, because a grasp of this will facilitateour understanding of how the other statistical procedures outlined belowwere applied as well.
In order to calculate the informants' responses in our study, I dividedthe map of Japan into a dot matrix with over 27,000 dots. I began withthe line(s) drawn by informant 1 to designate "standard" and determinedwhich of the dots were included inside the "standard" area. I repeatedthis procedure with all the informants who chose to indicate "standard".In this way, I determined, for each dot in the matrix, what percentageof the informants had included that dot within the area they called "standard".Thus, for each of the 27,000 some odd dots on the map, I obtained eightpercentage figures, one for each of the informant groups.
To determine if there was a statistically significant difference inthe percentage of Osaka informants and Nagoya informants who included acertain dot within the "standard" area, I performed the proportion teston the two percentages. I then repeated this test on the rest of the dotsin the map matrix and illustrated the results of these 27,000 significancetests on the map. In figure 3, I applied a diagonal striped pattern tothose areas which were included in the "standard" maps of either the Osakaor the Nagoya informants but which showed no significant difference. Thedark spotted pattern designates those areas where the Osaka informants'values were higher to a statistically significant degree. The lightly spottedpattern shows the same for those areas in which the Nagoya informants'values were higher.
Figure 3, Osaka and Nagoya informants "standard" (proportion testresults)
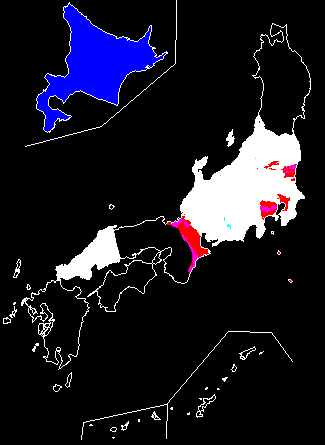
In other words, figure 3 shows (1) areas which Osaka informants weremore prone to label "standard", (2) areas which Nagoya informants weremore inclined to include in the area called "standard", and (3) areas whichshowed no significant difference between the two. In the first category,we find the island of Hokkaidô. In the second, we find parts of theKantô region around Tokyo, as well as a sizable portion of the Kansairegion (the region which contains Osaka). These results can be interpretedin the light of previous studies which have shown that speakers from Osaka(and the other parts of the Kansai region) have a low regard for the speechof Tokyo and the Kantô region around it (see for example Long 1990b;Long forthcoming a; Inoue 1989: 161, 187). This negative impression hasmanifested itself in the data here in the form of the reluctance shownby many Osaka informants to acknowledge the Kantô area as being standard-speaking.As we saw in figure 2, the percentage of Osaka informants who includedHokkaidô in the standard area was rather high, and we see in figure3 that, when compared to the Nagoya informants, this difference is so greatit is statistically significant. Furthermore, we see that significantlymore of the Nagoya informants are willing to include portions of the Kansairegion in their standard-speaking area than are their Osaka counterparts.In other words, we see that the "home region exclusion" tendency mentionedearlier has been statistically verified. Although the number of Nagoyainformants who included this strip of the Kansai region in the standardwas low, the number of Osaka informants who did so was zero.
There is a limit to the usefulness of these proportion test maps, however.Since we have 8 informant groups, a thorough cross-comparison would requireus to create and examine 32 different maps. Thus, we are forced to searchfor more efficient ways of analyzing informant-group differences.
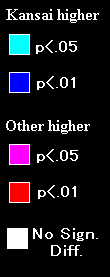
6. The Eight-Region Means Map
One method for obtaining an overall view of the entire body of datais to calculate the mean values for the eight informant groups. Mappingthese mean values gives us the map in figure 4. Here we see two tendenciesmentioned previously, that is the appearance of a strong Tokyo-centeredcore area, and a weaker tendency to include Hokkaidô in the standard-speakingarea. What's more, producing this average map gives us a new basis forcomparison. Rather than comparing the Nagoya map with the Osaka map, andthen the Nagoya with the Kagoshima, the Nagoya with the Tokyo, and so on,we can now compare each of the eight maps with this average map to examine,if not how each maps differs from each other map, at least how each mapdiffers from the average.
Figure 4, Eight informant groups "standard" (means)
Look again at the Osaka informants' "standard" percentage map in figure2. We see here that a high percentage of informants (between 60 and 79%),have included the area around Tokyo in their "standard" area. At first,this would appear to indicate that a large portion of the Osaka informantssee the Tokyo area as "standard", and to a degree it does. But when wecompare these results with those of the eight-region average map in whichthe Tokyo area ranks at the 80-100% level, we see that the Osaka informants'values are not very high. On the contrary, they are lower than average.The next step now is to determine whether our visual impressions of differencesbetween the Osaka map and the average are indeed statistically significant.We can accomplish this by standardizing the values for each informant group'smap.
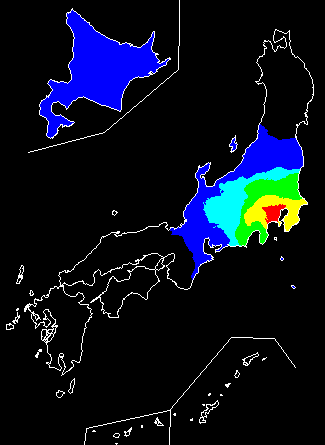
7. Standardized Values Map
I standardized the percentages for each dot on each of the eight mapsin order to see the levels on the maps not in isolation but in relationto the percentage levels of the other seven maps. This standardizationof the scores allows us, in effect, to compare each of the eight regionmaps with the average. In the standard score maps, the eight-region average(for that dot on the matrix) is set at 50 and the percentages are recalculatedso that those higher than average fall proportionately above 50, and thoselower fall proportionately below 50. Moreover, scores greater than 69.6,or less than 30.4 differ from the average to such an extent that the differenceis statistically significant.
Let us take another look at the Osaka informants' "standard" areas,but this time, rather than simply percentages, we will look at the standardizedvalues (figure 5). Whereas with the percentage map, it appeared that alarge number of our Osaka informants acknowledged the Tokyo area as a standard-speakingone, the standardized values map reveals this impression to be quite misleading.Even though in figure 2 the area in and around Tokyo ranked the highestwith numbers in the 60-79% percentage range, we find that these figuresare actually much lower than what we would expect given the eight-regionaverage. This is indicated on the map by the extremely light pattern. Moreover,in the center of this light area, we find that, in fact, the small areacomprising Tokyo prefecture itself is so much lower than the average (fallingbelow the 30.4 level) that the difference is statistically significant.
Figure 5, Osaka informants "standard" (standardized values)
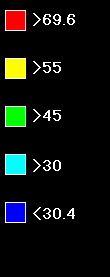
The high percentage of Osaka informants who included Hokkaidôis amplified in the standardized scores as well. For, although five ofthe seven other regions also included Hokkaidô to some extent intheir "standard" areas, we see that in the case of the Osaka informants,the tendency was so strong that the difference is statistically significant.Furthermore, the inclusion of Hiroshima (and environs) to the west of Osakawas only indicated by a small percentage of the Osaka informants and thusappeared as a very weak result on the percentage map, but the fact thatthis area was not included whatsoever in any of the seven other maps causesit to receive above-average (though not statistically significant) scoreson the standardized map here.
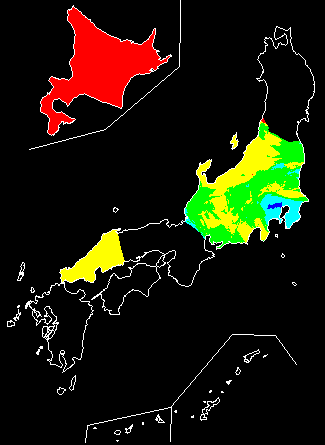
8. Standard Deviations Map
Above, we have seen disagreements among different regions of Japanas to just what areas speak "standard". Now, we will look at a way to measurethis degree of disagreement quantitatively and illustrate it on a map.Just as we standardized the scores for each dot on the map matrix above,we can calculate the standard deviation for each dot on the matrix as well.The higher the standard deviation is, the more disparity there was amongthe eight regions' "standard Japanese" values for that dot. In other words,a high standard deviation score shows that there was a great deal of disparityamong the percentages of the eight informant groups.
On the standard deviation map in figure 6, we find that the Tokyo areahas a very low standard deviation. This is because, in spite of the factthat the informants from the Osaka region had significantly low scoresfor this area, the remaining seven groups were basically in agreement aboutthis area's standardness. (All of them placed it in the 80-100% range.)The area which encountered the most disagreement among the eight groupswas the Chûbu region situated in the center of the main island. Thisis indeed an area whose standardness is often disputed, both by linguistsas well as the average person on the street.
Figure 6, Eight informant groups "standard" (standard deviations)
9. Topics for Future Research
In this paper, I introduced some innovations to the perceptual dialectologymethodology to examine the perceptions of standard Japanese held by informantsnative to two different geographical regions. I developed a technique forcomparing two composite maps and for showing those areas which differ significantlyin a map format. Using this method, I found that informants from differentregions of Japan had noticeably different (often to a statistically significantdegree) ideas about what areas speak standard Japanese. In particular,I found that informants from Osaka are reluctant to acknowledge the Tokyoregion as a standard-speaking one, a finding which reinforces the evidenceof Osaka's linguistic rivalry with Tokyo seen in previous studies. Furthermore,I found that standardized score maps were an effective tool in revealingunique qualities of informant groups which had been obscured in simplepercentage maps. Finally, I demonstrated how the mapping of standard deviationscould be used to determine what areas were the subject of disagreementamong informant groups.
In one of the survey questions not analyzed in this paper, informantswere asked to list specific traits which they thought characterized thespeech regions they had indicated (Long 1993, Long forthcoming b). Professionallinguists have long asserted the existence of both "standard Japanese"and of a "Tokyo dialect". Preliminary analyses of the specific linguisticcharacteristics which our informants associate with these two speech varietiessuggest, however, that non-linguists may not differentiate between thetwo in strictly linguistic terms. In the future, I wish to pursue thistype of problem in an attempt to shed new light on not just the "where"issues of standard language perception, but the "what" issues as well.
Notes
1. With some of the Japanese variety descriptors, it is difficult tofind English translations which adequately convey their semantic traitsand usages. Although ben and hôgen are both used torefer to an entire language system (and hence correspond to the Englishword 'dialect' as it is used by linguists), ben is much more commonlyused among ordinary people in everyday speech, while hôgenhas a more technical ring to it. To complicate the situation, however,non-linguists commonly use the word hôgen to refer to theindividual lexical items of a dialect, and thus make comments such as,"Osaka-ben ha hôgen ga ôi", 'there are a lot of hôgenin Osaka-ben'. (Return to text)
2. The figures for "standard Japanese" are mainly those who gave thespeech variety hyôjungo (usually translated as 'standard Japanese'),but with a few responses for kyôtsûgo (usually translatedas 'common Japanese') included as well. These were combined because the'common Japanese' maps were very few in number, and because a preliminaryanalysis of the perceptual regions of the two varieties showed no noticeabledifferences between the two. The exact numbers of the 20 kyôtsûgoresponses included in table 1 is as follows: Tokyo (1), Nagoya (1), Kanazawa(3), Osaka (2), Fukuoka (12), Kagoshima (1).(Returnto text)
3. In the survey, informants were given a blank map of Japan with onlyprefectural boundaries shown and asked to (1) draw lines to show areaswhere people "spoke differently", (2) label these areas if there was aname for these ways of speaking, (3) to list characteristics of these waysof speaking.(Return to text)
4. In addition to the Nagoya and Osaka informants discussed here, theGifu and the Kanazawa informants excluded their own home regions from thearea they labeled as "standard". The Hiroshima informants also excludedtheir home region from the "standard", although this does not come as sucha surprise because their area is further geographically from Tokyo andis not usually thought of as being standard-speaking. Even so, in lightof the fact that at least a few informants from another region (namelyOsaka) included the Hiroshima area in their "standard" while none of theHiroshima informants themselves did, we can view even this as an exampleof "home region exclusion". None of the informants from the two surveysites on the southern island of Kyûshû (Fukuoka and Kagoshima)labeled areas of their island as "standard", but since none of the informantsfrom other regions did so either, it would be erroneous to view this asthe same type of tendency. Still, in the end, the only one of the eightinformant groups which did display a positive tendency to include the homeregion within their "standard" area was the Tokyo informant group. (Mapsfor the data mentioned here may be found in Long 1997.) (Returnto text)
5. The Northern-most island of Hokkaidô was not widely settledby Japanese speakers until the late 19th century. Settlers came from allparts of Japan, and the resulting dialect mixing and leveling, combinedwith the effects of standard language education in the schools, produceda variety which is very similar to the standard.(Returnto text)
ReferencesDavis, Lawrence (1990) Statistics in Dialectology.Tuscaloosa: University of Alabama Press.Inoue, Fumio (1989) Hanashi-kotoba shin-fûkei[New Landscapes of Spoken Japanese], Tokyo: Akiyama Shoten.
Long, Daniel (1990a) Hôgen ninchi chizu no kakikatato yomikata [The Drawing and Reading of Perceptual Dialectology Maps],Proceedings of the Dialectological Circle of Japan 50: 7-16. (Portionsof this article have been incorporated into Long forthcoming b.)
Long, Daniel (1990b) Hôgen sesshoku ni yoru hôgenishiki to kôdô. [Dialect attitudes and behavior as the resultof dialect contact: free response answers from a survey of migrants' dialects]Chiiki Gengo 2: 3-12.
Long, Daniel (1993) The Role of Linguistic Features inPerceptual Dialect Regions. Proceedings of the XVth International Congressof Linguists, vol. 3. Ed. André Crochetière, Jean-ClaudeBoulanger, Conrad Ouellon. Québec: Les Presses de L'UniversitéLaval, 371-374. (Portions of this article have been incorporated into Longforthcoming b.)
Long, Daniel (1997) A Perceptual Dialect Atlas of Japan.Japanese Language Research Center Reports 5: 45-84.
Long, Daniel (forthcoming a) Mapping non-linguists' evaluationsof Japanese language variation. Handbook of Perceptual Dialectology.Ed. Dennis Preston. Los Angeles: Sage Publications.
Long, Daniel (forthcoming b) Geographical Perceptionsof Japanese Dialect Regions. Handbook of Perceptual Dialectology.Ed. Dennis Preston. Los Angeles: Sage Publications.
Preston, Dennis (1988) Methods in the Study of DialectPerceptions, Methods in Dialectology, Clevedon: Multilingual Matters,373-395.
Preston, Dennis (1989) Perceptual Dialectology,Dordrecht: Foris.
Shibatani, Masayoshi (1990) The Languages of Japan,Cambridge: Cambridge University Press.