 Perceptual Dialect
Maps of Japan
Perceptual Dialect
Maps of Japan- "Most Pleasant" Speech Areas -
 Perceptual Dialect
Maps of Japan
Perceptual Dialect
Maps of Japan| Informant Group | "Most Pleasant"
Percentages Color-key |
"Most Pleasant"
Standardized Scores Color-key |
Kanto |
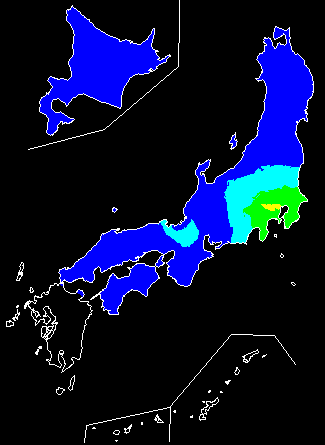 |
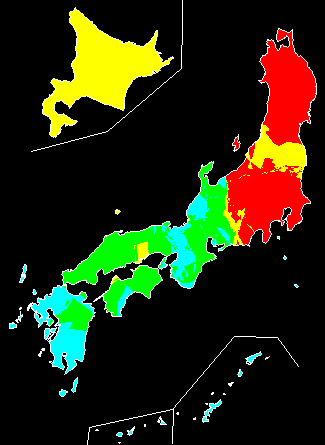 |
Aichi |
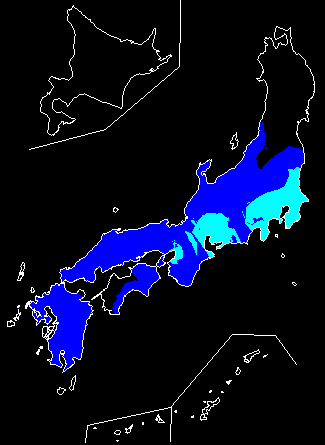 |
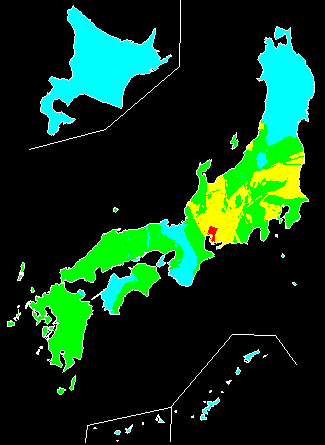 |
Gifu |
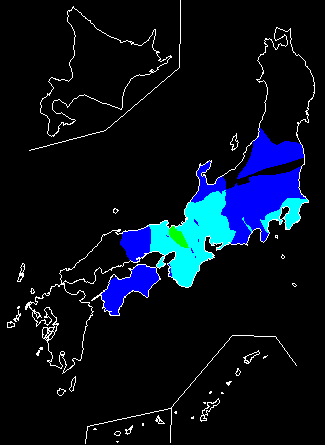 |
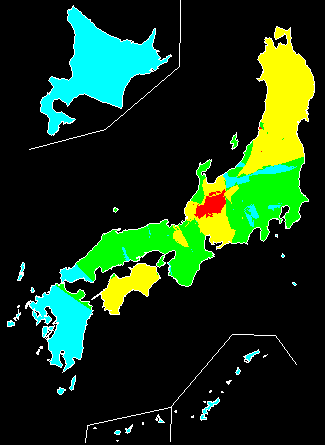 |
Kanazawa |
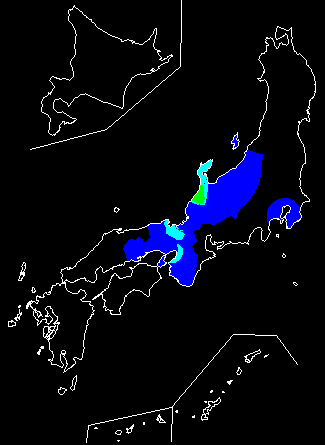 |
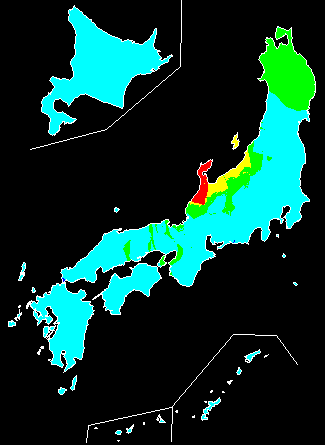 |
Kansai |
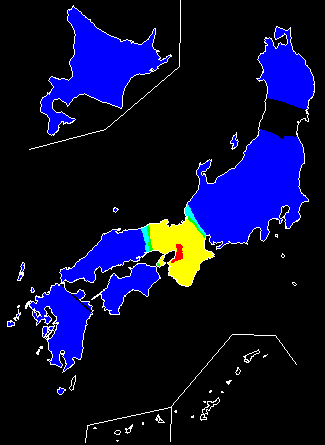 |
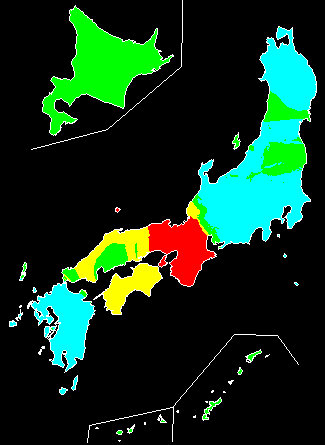 |
Hiroshima |
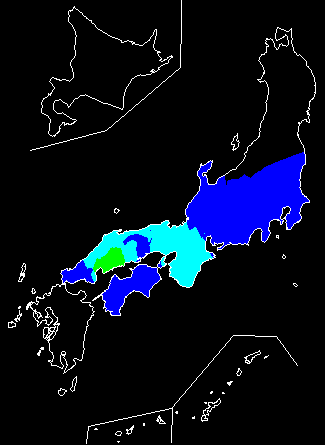 |
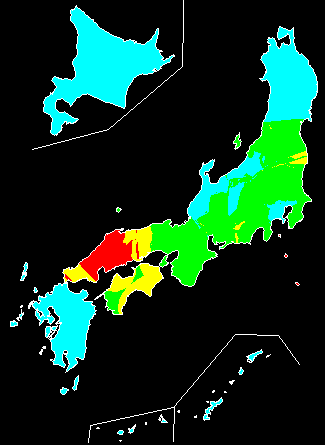 |
Fukuoka |
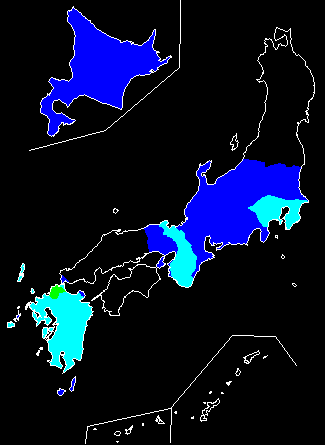 |
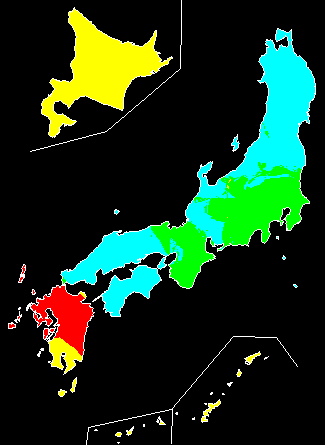 |
Kagoshima |
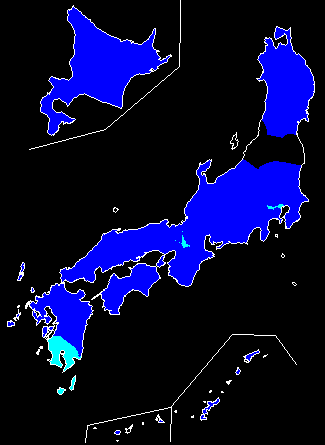 |
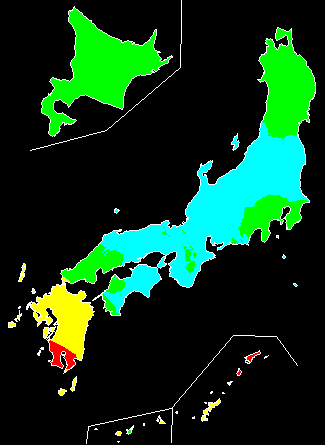 |
8 Region Means
|
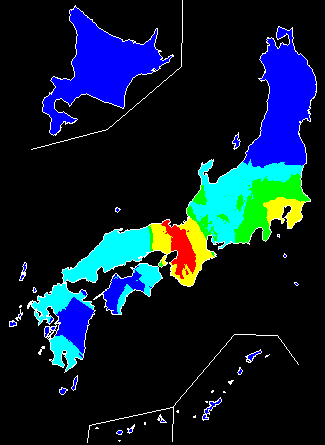 |
8 Region
|
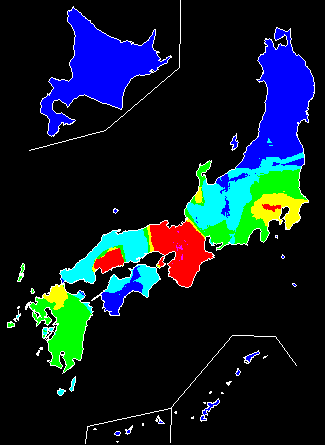 |
Click on the maps above to see larger versions.
This page was created by Daniel Long. The maps were produced using PDQ (Perceptual Dialect Quantifier for Windows 95), designed by Daniel Long and programmed by Isao Onishi.
Return to the Perceptual
Dialect Maps Home Page